
A1 · Beginner
Vancouver CMA Family-Owned SMEs: A Dated Ownership Survey
Official enterprise survey data measure majority same-family ownership across Metro Vancouver while maintaining explicit reference-year and quality boundaries.
Vancouver CMA Survey Geography
Statistics Canada Table 33-10-0459-01 documents business ownership characteristics across Canadian census metropolitan areas.
The survey geography corresponds specifically to the Vancouver Census Metropolitan Area in British Columbia.
Boundaries encompass urban core municipalities, suburban districts, and adjacent commuter municipalities within Metro Vancouver.
Statistical sampling draws from the standardized Business Register of active commercial enterprises.
Metropolitan area boundaries isolate local commercial data from broader provincial British Columbia aggregates.
Table definitions prohibit extending Vancouver CMA ownership ratios to non-metropolitan or rural regions.

Target-Population SME Scope
The Survey on Financing and Growth of Small and Medium Enterprises evaluates commercial employer firms with 1 to 499 employees.
Survey parameters establish a mandatory annual gross revenue threshold of at least 30,000 dollars.
Target population rules deliberately exclude non-employer micro-enterprises and self-employed solo practitioners.
Public administration bodies, schools, hospitals, and non-profit charities are systematically excluded from the SME frame.
Regulated utility monopolies and commercial financial institutions are omitted from the target population.
Target-population constraints limit survey coverage strictly to active commercial private-sector employer firms.
Majority Same-Family Ownership Definition
The survey strictly defines family-owned enterprises as businesses where more than 50 percent of ownership is held by members of the same family.
Ownership classification evaluates legal equity holding rather than operational day-to-day management roles.
The definition does not indicate whether enterprise employees belong to the owning family.
Majority same-family ownership does not measure multi-generational business succession or transfer plans.
Survey criteria differentiate same-family ownership from broader cooperative or employee-owned corporate structures.
Legal family ownership status does not provide data on total household income derived from business activities.
Business-Size and Industry Comparisons
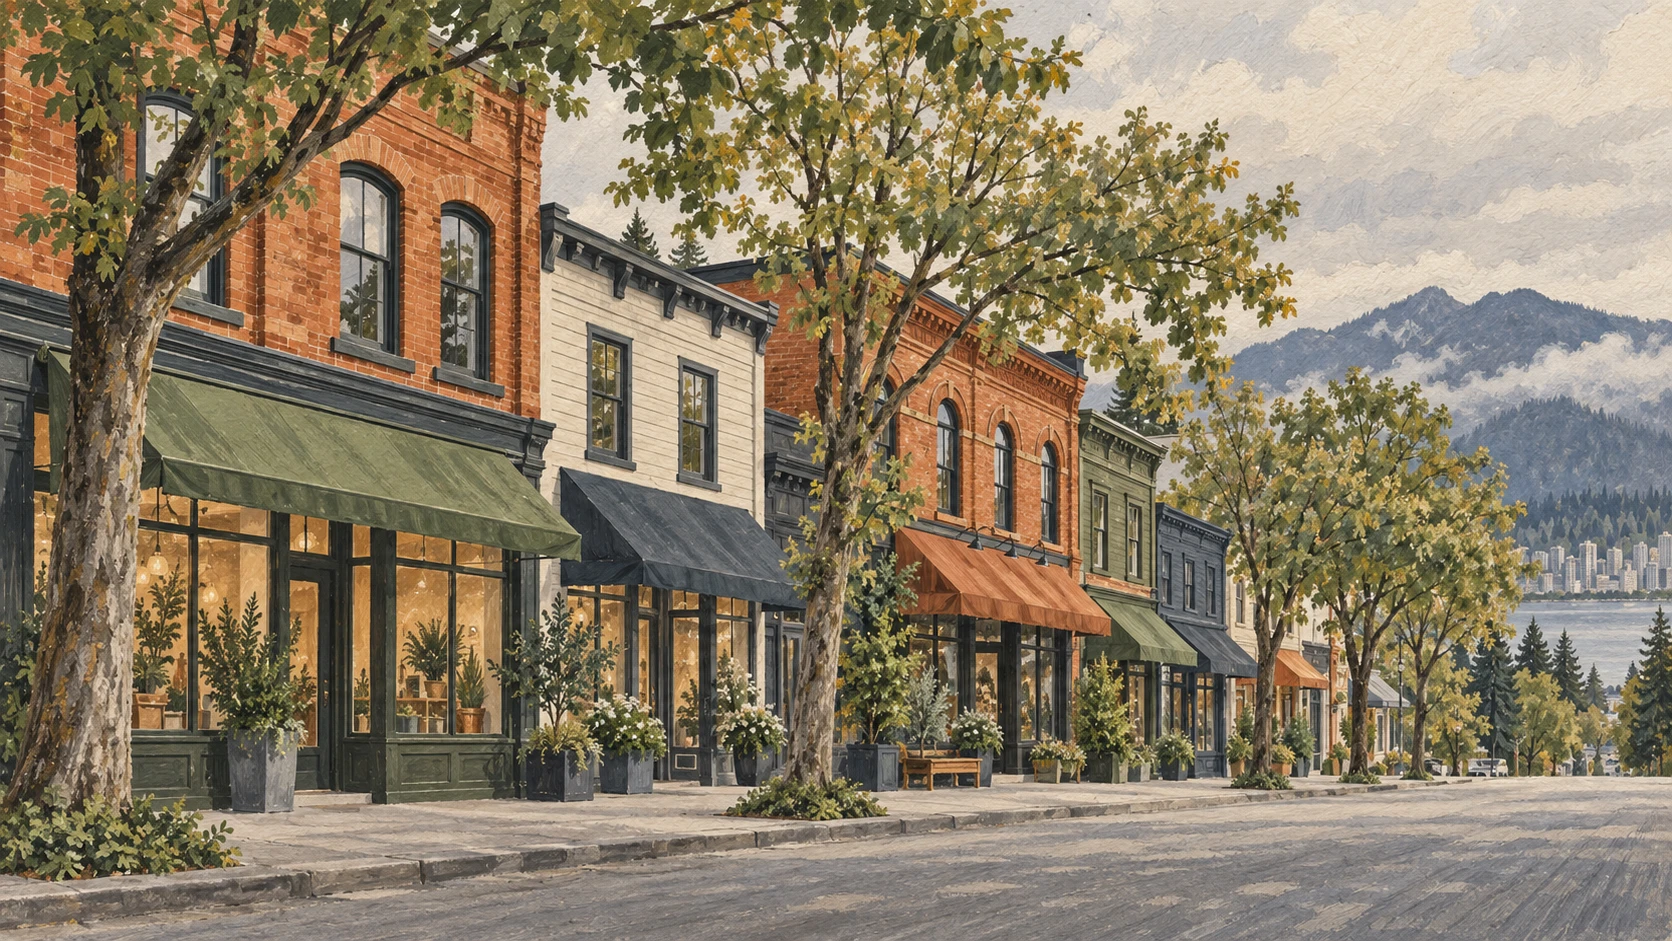
Official cross-tabs partition surveyed enterprises across micro, small, and medium business employment size brackets.
Majority same-family ownership rates vary significantly between micro-businesses and larger mid-sized firms.
Survey tables categorize enterprises across standard North American Industry Classification System industry sectors.
Construction, retail trade, and food services demonstrate substantial concentrations of family-owned enterprises.
Professional, scientific, and technical services exhibit distinct corporate equity arrangements with lower family ownership shares.
Industry cross-tabs reflect differing capital requirements, professional partnerships, and operational overhead scales.
The 2020 Value and Status-B Flag
Table 33-10-0459-01 records that 32.7 percent of surveyed Vancouver CMA SMEs reported majority same-family ownership in 2020.
The specific estimate is tracked under Statistics Canada vector v1296910853 and coordinate 1.38.9.
Statistics Canada assigned a data quality symbol of B to the Vancouver CMA family-ownership estimate.
The status-B data quality symbol indicates moderate sampling variability with a coefficient of variation between 5.0 and 15.0 percent.
A technical correction notice was formally applied to regional and urban tables on April 22, 2022.
The recorded 32.7 percent metric represents a point-in-time cross-sectional estimate for reference year 2020.
Analytical Boundaries and Survey Limits
Survey percentages cannot be extrapolated to characterize every commercial enterprise operating across Vancouver.
The survey estimate does not capture informal, unrecorded, or subsistence family work within the local economy.
Quantitative ownership shares do not measure the commercial viability, profitability, or debt burdens of local businesses.
The data tables provide no information on local commercial property leases, inflation pressures, or storefront turnover rates.
Survey responses do not identify the cultural, linguistic, or ethnic background of business owners.
Rigorous economic reporting preserves the specific 2020 reference year and statistical status-B quality parameters.
A2 · Elementary
Vancouver CMA Family-Owned SMEs: A Dated Ownership Survey
Official enterprise survey data measure majority same-family ownership across Metro Vancouver while maintaining explicit reference-year and quality boundaries.
Vancouver CMA Survey Geography
Statistics Canada Table 33-10-0459-01 documents business ownership characteristics across Canadian census metropolitan areas.
The survey geography corresponds specifically to the Vancouver Census Metropolitan Area in British Columbia.
Boundaries encompass urban core municipalities, suburban districts, and adjacent commuter municipalities within Metro Vancouver.
Statistical sampling draws from the standardized Business Register of active commercial enterprises.
Metropolitan area boundaries isolate local commercial data from broader provincial British Columbia aggregates.
Table definitions prohibit extending Vancouver CMA ownership ratios to non-metropolitan or rural regions.
Target-Population SME Scope
The Survey on Financing and Growth of Small and Medium Enterprises evaluates commercial employer firms with 1 to 499 employees.
Survey parameters establish a mandatory annual gross revenue threshold of at least 30,000 dollars.
Target population rules deliberately exclude non-employer micro-enterprises and self-employed solo practitioners.
Public administration bodies, schools, hospitals, and non-profit charities are systematically excluded from the SME frame.
Regulated utility monopolies and commercial financial institutions are omitted from the target population.
Target-population constraints limit survey coverage strictly to active commercial private-sector employer firms.
Majority Same-Family Ownership Definition
The survey strictly defines family-owned enterprises as businesses where more than 50 percent of ownership is held by members of the same family.
Ownership classification evaluates legal equity holding rather than operational day-to-day management roles.
The definition does not indicate whether enterprise employees belong to the owning family.
Majority same-family ownership does not measure multi-generational business succession or transfer plans.
Survey criteria differentiate same-family ownership from broader cooperative or employee-owned corporate structures.
Legal family ownership status does not provide data on total household income derived from business activities.
Business-Size and Industry Comparisons
Official cross-tabs partition surveyed enterprises across micro, small, and medium business employment size brackets.
Majority same-family ownership rates vary significantly between micro-businesses and larger mid-sized firms.
Survey tables categorize enterprises across standard North American Industry Classification System industry sectors.
Construction, retail trade, and food services demonstrate substantial concentrations of family-owned enterprises.
Professional, scientific, and technical services exhibit distinct corporate equity arrangements with lower family ownership shares.
Industry cross-tabs reflect differing capital requirements, professional partnerships, and operational overhead scales.
The 2020 Value and Status-B Flag
Table 33-10-0459-01 records that 32.7 percent of surveyed Vancouver CMA SMEs reported majority same-family ownership in 2020.
The specific estimate is tracked under Statistics Canada vector v1296910853 and coordinate 1.38.9.
Statistics Canada assigned a data quality symbol of B to the Vancouver CMA family-ownership estimate.
The status-B data quality symbol indicates moderate sampling variability with a coefficient of variation between 5.0 and 15.0 percent.
A technical correction notice was formally applied to regional and urban tables on April 22, 2022.
The recorded 32.7 percent metric represents a point-in-time cross-sectional estimate for reference year 2020.
Analytical Boundaries and Survey Limits
Survey percentages cannot be extrapolated to characterize every commercial enterprise operating across Vancouver.
The survey estimate does not capture informal, unrecorded, or subsistence family work within the local economy.
Quantitative ownership shares do not measure the commercial viability, profitability, or debt burdens of local businesses.
The data tables provide no information on local commercial property leases, inflation pressures, or storefront turnover rates.
Survey responses do not identify the cultural, linguistic, or ethnic background of business owners.
Rigorous economic reporting preserves the specific 2020 reference year and statistical status-B quality parameters.
B1 · Intermediate
Vancouver CMA Family-Owned SMEs: A Dated Ownership Survey
Official enterprise survey data measure majority same-family ownership across Metro Vancouver while maintaining explicit reference-year and quality boundaries.
Vancouver CMA Survey Geography
Statistics Canada Table 33-10-0459-01 documents business ownership characteristics across Canadian census metropolitan areas.
The survey geography corresponds specifically to the Vancouver Census Metropolitan Area in British Columbia.
Boundaries encompass urban core municipalities, suburban districts, and adjacent commuter municipalities within Metro Vancouver.
Statistical sampling draws from the standardized Business Register of active commercial enterprises.
Metropolitan area boundaries isolate local commercial data from broader provincial British Columbia aggregates.
Table definitions prohibit extending Vancouver CMA ownership ratios to non-metropolitan or rural regions.
Target-Population SME Scope
The Survey on Financing and Growth of Small and Medium Enterprises evaluates commercial employer firms with 1 to 499 employees.
Survey parameters establish a mandatory annual gross revenue threshold of at least 30,000 dollars.
Target population rules deliberately exclude non-employer micro-enterprises and self-employed solo practitioners.
Public administration bodies, schools, hospitals, and non-profit charities are systematically excluded from the SME frame.
Regulated utility monopolies and commercial financial institutions are omitted from the target population.
Target-population constraints limit survey coverage strictly to active commercial private-sector employer firms.
Majority Same-Family Ownership Definition
The survey strictly defines family-owned enterprises as businesses where more than 50 percent of ownership is held by members of the same family.
Ownership classification evaluates legal equity holding rather than operational day-to-day management roles.
The definition does not indicate whether enterprise employees belong to the owning family.
Majority same-family ownership does not measure multi-generational business succession or transfer plans.
Survey criteria differentiate same-family ownership from broader cooperative or employee-owned corporate structures.
Legal family ownership status does not provide data on total household income derived from business activities.
Business-Size and Industry Comparisons
Official cross-tabs partition surveyed enterprises across micro, small, and medium business employment size brackets.
Majority same-family ownership rates vary significantly between micro-businesses and larger mid-sized firms.
Survey tables categorize enterprises across standard North American Industry Classification System industry sectors.
Construction, retail trade, and food services demonstrate substantial concentrations of family-owned enterprises.
Professional, scientific, and technical services exhibit distinct corporate equity arrangements with lower family ownership shares.
Industry cross-tabs reflect differing capital requirements, professional partnerships, and operational overhead scales.
The 2020 Value and Status-B Flag
Table 33-10-0459-01 records that 32.7 percent of surveyed Vancouver CMA SMEs reported majority same-family ownership in 2020.
The specific estimate is tracked under Statistics Canada vector v1296910853 and coordinate 1.38.9.
Statistics Canada assigned a data quality symbol of B to the Vancouver CMA family-ownership estimate.
The status-B data quality symbol indicates moderate sampling variability with a coefficient of variation between 5.0 and 15.0 percent.
A technical correction notice was formally applied to regional and urban tables on April 22, 2022.
The recorded 32.7 percent metric represents a point-in-time cross-sectional estimate for reference year 2020.
Analytical Boundaries and Survey Limits
Survey percentages cannot be extrapolated to characterize every commercial enterprise operating across Vancouver.
The survey estimate does not capture informal, unrecorded, or subsistence family work within the local economy.
Quantitative ownership shares do not measure the commercial viability, profitability, or debt burdens of local businesses.
The data tables provide no information on local commercial property leases, inflation pressures, or storefront turnover rates.
Survey responses do not identify the cultural, linguistic, or ethnic background of business owners.
Rigorous economic reporting preserves the specific 2020 reference year and statistical status-B quality parameters.
B2 · Upper Intermediate
Vancouver CMA Family-Owned SMEs: A Dated Ownership Survey
Official enterprise survey data measure majority same-family ownership across Metro Vancouver while maintaining explicit reference-year and quality boundaries.
Vancouver CMA Survey Geography
Statistics Canada Table 33-10-0459-01 documents business ownership characteristics across Canadian census metropolitan areas.
The survey geography corresponds specifically to the Vancouver Census Metropolitan Area in British Columbia.
Boundaries encompass urban core municipalities, suburban districts, and adjacent commuter municipalities within Metro Vancouver.
Statistical sampling draws from the standardized Business Register of active commercial enterprises.
Metropolitan area boundaries isolate local commercial data from broader provincial British Columbia aggregates.
Table definitions prohibit extending Vancouver CMA ownership ratios to non-metropolitan or rural regions.
Target-Population SME Scope
The Survey on Financing and Growth of Small and Medium Enterprises evaluates commercial employer firms with 1 to 499 employees.
Survey parameters establish a mandatory annual gross revenue threshold of at least 30,000 dollars.
Target population rules deliberately exclude non-employer micro-enterprises and self-employed solo practitioners.
Public administration bodies, schools, hospitals, and non-profit charities are systematically excluded from the SME frame.
Regulated utility monopolies and commercial financial institutions are omitted from the target population.
Target-population constraints limit survey coverage strictly to active commercial private-sector employer firms.
Majority Same-Family Ownership Definition
The survey strictly defines family-owned enterprises as businesses where more than 50 percent of ownership is held by members of the same family.
Ownership classification evaluates legal equity holding rather than operational day-to-day management roles.
The definition does not indicate whether enterprise employees belong to the owning family.
Majority same-family ownership does not measure multi-generational business succession or transfer plans.
Survey criteria differentiate same-family ownership from broader cooperative or employee-owned corporate structures.
Legal family ownership status does not provide data on total household income derived from business activities.
Business-Size and Industry Comparisons
Official cross-tabs partition surveyed enterprises across micro, small, and medium business employment size brackets.
Majority same-family ownership rates vary significantly between micro-businesses and larger mid-sized firms.
Survey tables categorize enterprises across standard North American Industry Classification System industry sectors.
Construction, retail trade, and food services demonstrate substantial concentrations of family-owned enterprises.
Professional, scientific, and technical services exhibit distinct corporate equity arrangements with lower family ownership shares.
Industry cross-tabs reflect differing capital requirements, professional partnerships, and operational overhead scales.
The 2020 Value and Status-B Flag
Table 33-10-0459-01 records that 32.7 percent of surveyed Vancouver CMA SMEs reported majority same-family ownership in 2020.
The specific estimate is tracked under Statistics Canada vector v1296910853 and coordinate 1.38.9.
Statistics Canada assigned a data quality symbol of B to the Vancouver CMA family-ownership estimate.
The status-B data quality symbol indicates moderate sampling variability with a coefficient of variation between 5.0 and 15.0 percent.
A technical correction notice was formally applied to regional and urban tables on April 22, 2022.
The recorded 32.7 percent metric represents a point-in-time cross-sectional estimate for reference year 2020.
Analytical Boundaries and Survey Limits
Survey percentages cannot be extrapolated to characterize every commercial enterprise operating across Vancouver.
The survey estimate does not capture informal, unrecorded, or subsistence family work within the local economy.
Quantitative ownership shares do not measure the commercial viability, profitability, or debt burdens of local businesses.
The data tables provide no information on local commercial property leases, inflation pressures, or storefront turnover rates.
Survey responses do not identify the cultural, linguistic, or ethnic background of business owners.
Rigorous economic reporting preserves the specific 2020 reference year and statistical status-B quality parameters.
C1 · Advanced
Vancouver CMA Family-Owned SMEs: A Dated Ownership Survey
Official enterprise survey data measure majority same-family ownership across Metro Vancouver while maintaining explicit reference-year and quality boundaries.
Vancouver CMA Survey Geography
Statistics Canada Table 33-10-0459-01 documents business ownership characteristics across Canadian census metropolitan areas.
The survey geography corresponds specifically to the Vancouver Census Metropolitan Area in British Columbia.
Boundaries encompass urban core municipalities, suburban districts, and adjacent commuter municipalities within Metro Vancouver.
Statistical sampling draws from the standardized Business Register of active commercial enterprises.
Metropolitan area boundaries isolate local commercial data from broader provincial British Columbia aggregates.
Table definitions prohibit extending Vancouver CMA ownership ratios to non-metropolitan or rural regions.
Target-Population SME Scope
The Survey on Financing and Growth of Small and Medium Enterprises evaluates commercial employer firms with 1 to 499 employees.
Survey parameters establish a mandatory annual gross revenue threshold of at least 30,000 dollars.
Target population rules deliberately exclude non-employer micro-enterprises and self-employed solo practitioners.
Public administration bodies, schools, hospitals, and non-profit charities are systematically excluded from the SME frame.
Regulated utility monopolies and commercial financial institutions are omitted from the target population.
Target-population constraints limit survey coverage strictly to active commercial private-sector employer firms.
Majority Same-Family Ownership Definition
The survey strictly defines family-owned enterprises as businesses where more than 50 percent of ownership is held by members of the same family.
Ownership classification evaluates legal equity holding rather than operational day-to-day management roles.
The definition does not indicate whether enterprise employees belong to the owning family.
Majority same-family ownership does not measure multi-generational business succession or transfer plans.
Survey criteria differentiate same-family ownership from broader cooperative or employee-owned corporate structures.
Legal family ownership status does not provide data on total household income derived from business activities.
Business-Size and Industry Comparisons
Official cross-tabs partition surveyed enterprises across micro, small, and medium business employment size brackets.
Majority same-family ownership rates vary significantly between micro-businesses and larger mid-sized firms.
Survey tables categorize enterprises across standard North American Industry Classification System industry sectors.
Construction, retail trade, and food services demonstrate substantial concentrations of family-owned enterprises.
Professional, scientific, and technical services exhibit distinct corporate equity arrangements with lower family ownership shares.
Industry cross-tabs reflect differing capital requirements, professional partnerships, and operational overhead scales.
The 2020 Value and Status-B Flag
Table 33-10-0459-01 records that 32.7 percent of surveyed Vancouver CMA SMEs reported majority same-family ownership in 2020.
The specific estimate is tracked under Statistics Canada vector v1296910853 and coordinate 1.38.9.
Statistics Canada assigned a data quality symbol of B to the Vancouver CMA family-ownership estimate.
The status-B data quality symbol indicates moderate sampling variability with a coefficient of variation between 5.0 and 15.0 percent.
A technical correction notice was formally applied to regional and urban tables on April 22, 2022.
The recorded 32.7 percent metric represents a point-in-time cross-sectional estimate for reference year 2020.
Analytical Boundaries and Survey Limits
Survey percentages cannot be extrapolated to characterize every commercial enterprise operating across Vancouver.
The survey estimate does not capture informal, unrecorded, or subsistence family work within the local economy.
Quantitative ownership shares do not measure the commercial viability, profitability, or debt burdens of local businesses.
The data tables provide no information on local commercial property leases, inflation pressures, or storefront turnover rates.
Survey responses do not identify the cultural, linguistic, or ethnic background of business owners.
Rigorous economic reporting preserves the specific 2020 reference year and statistical status-B quality parameters.
C2 · Mastery
Vancouver CMA Family-Owned SMEs: A Dated Ownership Survey
Official enterprise survey data measure majority same-family ownership across Metro Vancouver while maintaining explicit reference-year and quality boundaries.
Vancouver CMA Survey Geography
Statistics Canada Table 33-10-0459-01 documents business ownership characteristics across Canadian census metropolitan areas.
The survey geography corresponds specifically to the Vancouver Census Metropolitan Area in British Columbia.
Boundaries encompass urban core municipalities, suburban districts, and adjacent commuter municipalities within Metro Vancouver.
Statistical sampling draws from the standardized Business Register of active commercial enterprises.
Metropolitan area boundaries isolate local commercial data from broader provincial British Columbia aggregates.
Table definitions prohibit extending Vancouver CMA ownership ratios to non-metropolitan or rural regions.
Target-Population SME Scope
The Survey on Financing and Growth of Small and Medium Enterprises evaluates commercial employer firms with 1 to 499 employees.
Survey parameters establish a mandatory annual gross revenue threshold of at least 30,000 dollars.
Target population rules deliberately exclude non-employer micro-enterprises and self-employed solo practitioners.
Public administration bodies, schools, hospitals, and non-profit charities are systematically excluded from the SME frame.
Regulated utility monopolies and commercial financial institutions are omitted from the target population.
Target-population constraints limit survey coverage strictly to active commercial private-sector employer firms.
Majority Same-Family Ownership Definition
The survey strictly defines family-owned enterprises as businesses where more than 50 percent of ownership is held by members of the same family.
Ownership classification evaluates legal equity holding rather than operational day-to-day management roles.
The definition does not indicate whether enterprise employees belong to the owning family.
Majority same-family ownership does not measure multi-generational business succession or transfer plans.
Survey criteria differentiate same-family ownership from broader cooperative or employee-owned corporate structures.
Legal family ownership status does not provide data on total household income derived from business activities.
Business-Size and Industry Comparisons
Official cross-tabs partition surveyed enterprises across micro, small, and medium business employment size brackets.
Majority same-family ownership rates vary significantly between micro-businesses and larger mid-sized firms.
Survey tables categorize enterprises across standard North American Industry Classification System industry sectors.
Construction, retail trade, and food services demonstrate substantial concentrations of family-owned enterprises.
Professional, scientific, and technical services exhibit distinct corporate equity arrangements with lower family ownership shares.
Industry cross-tabs reflect differing capital requirements, professional partnerships, and operational overhead scales.
The 2020 Value and Status-B Flag
Table 33-10-0459-01 records that 32.7 percent of surveyed Vancouver CMA SMEs reported majority same-family ownership in 2020.
The specific estimate is tracked under Statistics Canada vector v1296910853 and coordinate 1.38.9.
Statistics Canada assigned a data quality symbol of B to the Vancouver CMA family-ownership estimate.
The status-B data quality symbol indicates moderate sampling variability with a coefficient of variation between 5.0 and 15.0 percent.
A technical correction notice was formally applied to regional and urban tables on April 22, 2022.
The recorded 32.7 percent metric represents a point-in-time cross-sectional estimate for reference year 2020.
Analytical Boundaries and Survey Limits
Survey percentages cannot be extrapolated to characterize every commercial enterprise operating across Vancouver.
The survey estimate does not capture informal, unrecorded, or subsistence family work within the local economy.
Quantitative ownership shares do not measure the commercial viability, profitability, or debt burdens of local businesses.
The data tables provide no information on local commercial property leases, inflation pressures, or storefront turnover rates.
Survey responses do not identify the cultural, linguistic, or ethnic background of business owners.
Rigorous economic reporting preserves the specific 2020 reference year and statistical status-B quality parameters.
Check your understanding
Choose how closely you want to revisit the article. You can refer back while answering, and review explanations when you finish.
Quick Quiz A1
Try one question, then create a free account for the full Quick Quiz. Sign Up Free
Answer every question before checking. There is no time limit.
Your results
/ 1 correct (%)
Read the explanations to see how each answer connects to the article.
-
To which specific geographic region does the survey geography correspond?
1. Answer:
Quick Quiz A2
Try one question, then create a free account for the full Quick Quiz. Sign Up Free
Answer every question before checking. There is no time limit.
Your results
/ 1 correct (%)
Read the explanations to see how each answer connects to the article.
-
To which specific geographic region does the survey geography correspond?
1. Answer:
Quick Quiz B1
Try one question, then create a free account for the full Quick Quiz. Sign Up Free
Answer every question before checking. There is no time limit.
Your results
/ 1 correct (%)
Read the explanations to see how each answer connects to the article.
-
To which specific geographic region does the survey geography correspond?
1. Answer:
Quick Quiz B2
Try one question, then create a free account for the full Quick Quiz. Sign Up Free
Answer every question before checking. There is no time limit.
Your results
/ 1 correct (%)
Read the explanations to see how each answer connects to the article.
-
To which specific geographic region does the survey geography correspond?
1. Answer:
Quick Quiz C1
Try one question, then create a free account for the full Quick Quiz. Sign Up Free
Answer every question before checking. There is no time limit.
Your results
/ 1 correct (%)
Read the explanations to see how each answer connects to the article.
-
To which specific geographic region does the survey geography correspond?
1. Answer:
Quick Quiz C2
Try one question, then create a free account for the full Quick Quiz. Sign Up Free
Answer every question before checking. There is no time limit.
Your results
/ 1 correct (%)
Read the explanations to see how each answer connects to the article.
-
To which specific geographic region does the survey geography correspond?
1. Answer:
