A1 · Beginner
Statistics Canada Western Division Rail Freight: A Reporting Geography
Monthly railway carloadings data capture origin freight tonnage across Western Canada while distinguishing statistical boundaries from individual corridors.
Western Division Statistical Geography
Statistics Canada defines the Western Division as freight rail loadings originating from Thunder Bay west to the Pacific Coast.
The Western Division represents a statistical reporting geography rather than an individual rail route, track corridor, or terminal complex.
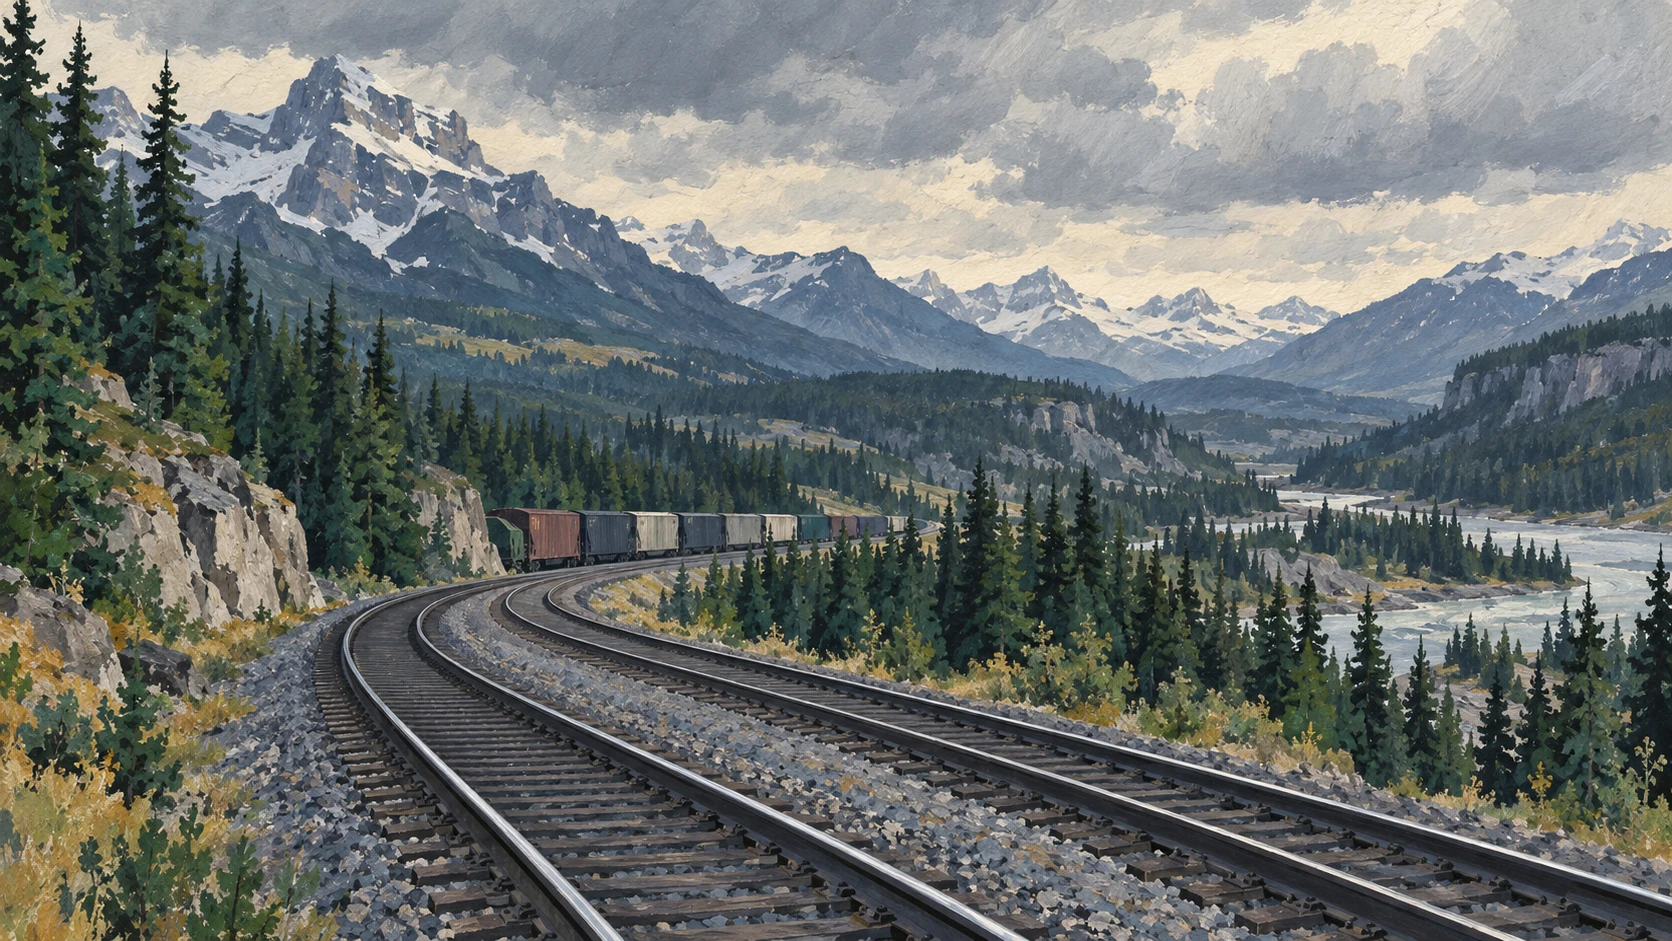
Data boundaries encompass railway trackage across northwestern Ontario, Manitoba, Saskatchewan, Alberta, and British Columbia.
Official reporting aggregates origin freight carloadings from multiple competing railway operators across western track networks.
The geographic boundary maintains consistency with long-standing historical grain transportation and freight accounting divisions.
Survey guidelines prohibit treating the entire division as a unified single-operator corridor or dedicated pipeline.
Monthly Total Tonnage Measurements
Statistics Canada records monthly freight rail volume in both carload counts and thousands of metric tonnes.
Western Division monthly freight volumes typically total between 15 and 18 million metric tonnes of carried commodities.
Monthly railway carloadings data are collected on an unadjusted basis and are not seasonally adjusted.
Loading volumes exhibit distinct seasonal variance driven by agricultural harvest schedules, severe winter weather, and construction demand.
Statistical tables report rail freight originated within the Western Division separately from eastern loadings and traffic received from American rail connections.
Monthly carload counts provide an immediate operational metric of rolling stock utilization across western rail terminals.
Intermodal and Non-Intermodal Freight Dynamics
Official statistics categorize all western railway freight into non-intermodal carload traffic and intermodal container shipments.
Non-intermodal bulk commodities constitute the vast majority of total western tonnage, usually exceeding 85 percent of all loadings.
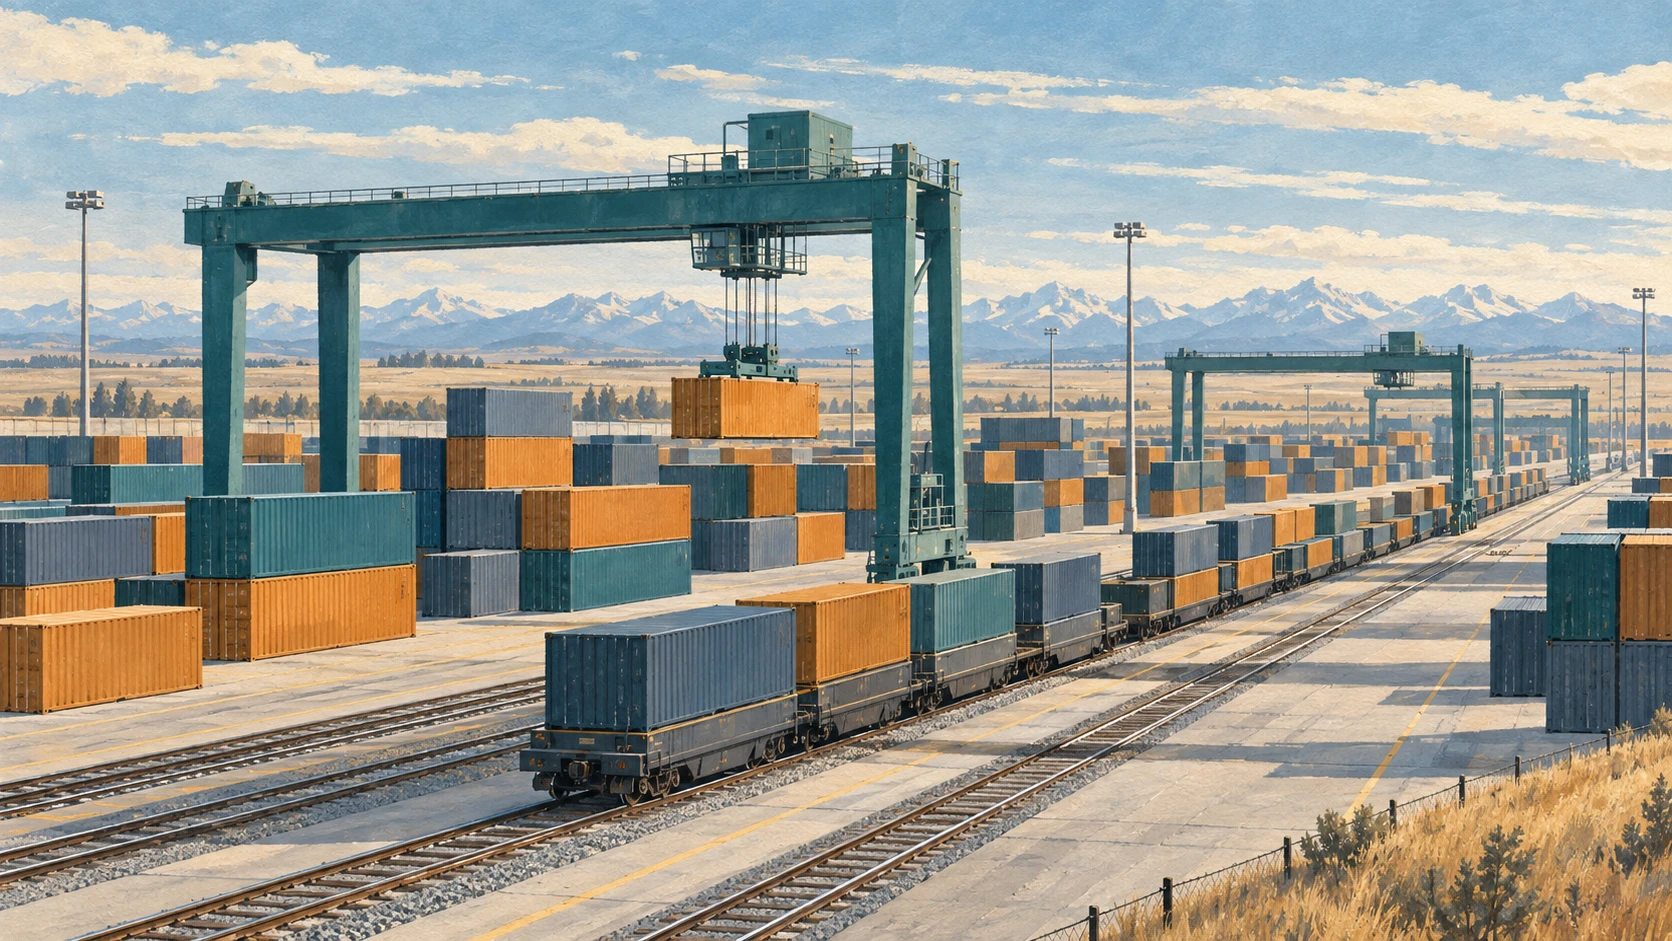
Intermodal freight measures cargo packed into standardized containers and trailers transported on dedicated flatcars or well cars.
Intermodal tonnage connects inland western distribution hubs with Pacific container terminals located in Vancouver and Prince Rupert.
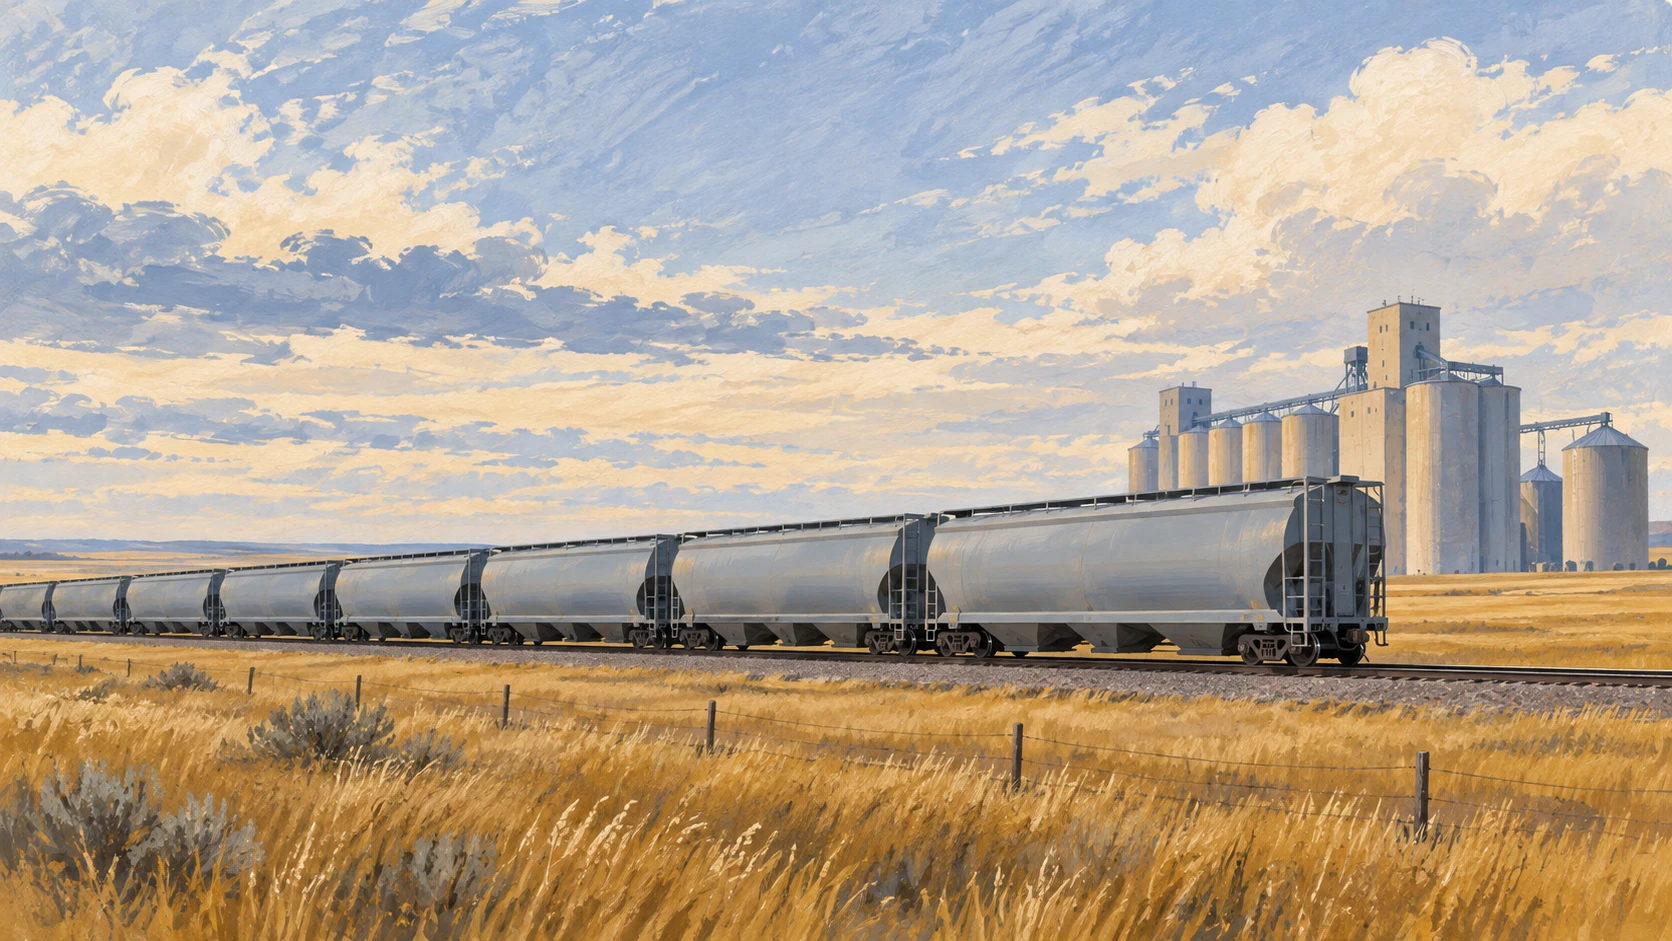
Non-intermodal rail movements utilize specialized heavy rolling stock including covered grain hoppers, tank cars, gondolas, and centerbeam flatcars.
Containerized intermodal freight maintains faster velocity schedules compared to heavy bulk unit train movements.
Primary Commodity Volume Tracking
Official tables track non-intermodal railway carloadings across 64 discrete commodity categories derived from standard classification systems.
Agricultural products represent a core commodity category, with wheat, canola, and specialty crops generating hundreds of thousands of monthly tonnes.
Mined commodities including coal and potash account for substantial non-intermodal carloadings originating in Alberta, British Columbia, and Saskatchewan.
Forestry products including lumber, wood pulp, and paper generate recurring monthly freight traffic from interior mills across British Columbia and Alberta.
Energy commodities such as crude oil, fuel products, and liquefied gases are quantified under chemical and petroleum product headings.
Monthly commodity data records the net weight of cargo loaded, excluding the tare weight of rail freight cars.
Strategic Corridors and Western Cargo Flows
Western rail traffic flows along dual transcontinental mainlines cutting through the Rocky Mountains and Fraser Canyon river passes toward coastal marine gateways.
Thunder Bay serves as the eastern boundary and primary lake port linking prairie grain gathering with Great Lakes marine shipping.
Pacific port terminals receive the majority of export-directed western bulk unit trains and intermodal flatcars.
Inland primary grain elevators coordinate unit train assembly of up to 134 hopper cars to maximize rail network velocity.
Severe winter conditions in western mountain corridors necessitate reduced train lengths and lower operating speeds to maintain safety.
Southbound rail corridors connect western Canadian production hubs with major American railway interchanges and Midwestern markets.

Analytical Limits and Monthly Revisions
Statistics Canada systematically revises railway carloadings data with each subsequent monthly release to incorporate delayed operator returns.
Carloading statistics record the volume of freight initially loaded on Canadian tracks but do not track ultimate delivery destinations.
Freight loading totals cannot be directly equated with export trade figures or marine terminal vessel discharge volumes.
Data tables capture origin activity within western boundaries but exclude railway track maintenance capital expenditures and labor dispute metrics.
Statistical confidentiality rules suppress individual commodity carload figures when a single carrier or shipper dominates a specific movement.
Sound economic analysis treats Western Division carloadings as a measure of origin freight throughput rather than a comprehensive national trade balance.
A2 · Elementary
Statistics Canada Western Division Rail Freight: A Reporting Geography
Monthly railway carloadings data capture origin freight tonnage across Western Canada while distinguishing statistical boundaries from individual corridors.
Western Division Statistical Geography
Statistics Canada defines the Western Division as freight rail loadings originating from Thunder Bay west to the Pacific Coast.
The Western Division represents a statistical reporting geography rather than an individual rail route, track corridor, or terminal complex.
Data boundaries encompass railway trackage across northwestern Ontario, Manitoba, Saskatchewan, Alberta, and British Columbia.
Official reporting aggregates origin freight carloadings from multiple competing railway operators across western track networks.
The geographic boundary maintains consistency with long-standing historical grain transportation and freight accounting divisions.
Survey guidelines prohibit treating the entire division as a unified single-operator corridor or dedicated pipeline.
Monthly Total Tonnage Measurements
Statistics Canada records monthly freight rail volume in both carload counts and thousands of metric tonnes.
Western Division monthly freight volumes typically total between 15 and 18 million metric tonnes of carried commodities.
Monthly railway carloadings data are collected on an unadjusted basis and are not seasonally adjusted.
Loading volumes exhibit distinct seasonal variance driven by agricultural harvest schedules, severe winter weather, and construction demand.
Statistical tables report rail freight originated within the Western Division separately from eastern loadings and traffic received from American rail connections.
Monthly carload counts provide an immediate operational metric of rolling stock utilization across western rail terminals.
Intermodal and Non-Intermodal Freight Dynamics
Official statistics categorize all western railway freight into non-intermodal carload traffic and intermodal container shipments.
Non-intermodal bulk commodities constitute the vast majority of total western tonnage, usually exceeding 85 percent of all loadings.
Intermodal freight measures cargo packed into standardized containers and trailers transported on dedicated flatcars or well cars.
Intermodal tonnage connects inland western distribution hubs with Pacific container terminals located in Vancouver and Prince Rupert.
Non-intermodal rail movements utilize specialized heavy rolling stock including covered grain hoppers, tank cars, gondolas, and centerbeam flatcars.
Containerized intermodal freight maintains faster velocity schedules compared to heavy bulk unit train movements.
Primary Commodity Volume Tracking
Official tables track non-intermodal railway carloadings across 64 discrete commodity categories derived from standard classification systems.
Agricultural products represent a core commodity category, with wheat, canola, and specialty crops generating hundreds of thousands of monthly tonnes.
Mined commodities including coal and potash account for substantial non-intermodal carloadings originating in Alberta, British Columbia, and Saskatchewan.
Forestry products including lumber, wood pulp, and paper generate recurring monthly freight traffic from interior mills across British Columbia and Alberta.
Energy commodities such as crude oil, fuel products, and liquefied gases are quantified under chemical and petroleum product headings.
Monthly commodity data records the net weight of cargo loaded, excluding the tare weight of rail freight cars.
Strategic Corridors and Western Cargo Flows
Western rail traffic flows along dual transcontinental mainlines cutting through the Rocky Mountains and Fraser Canyon river passes toward coastal marine gateways.
Thunder Bay serves as the eastern boundary and primary lake port linking prairie grain gathering with Great Lakes marine shipping.
Pacific port terminals receive the majority of export-directed western bulk unit trains and intermodal flatcars.
Inland primary grain elevators coordinate unit train assembly of up to 134 hopper cars to maximize rail network velocity.
Severe winter conditions in western mountain corridors necessitate reduced train lengths and lower operating speeds to maintain safety.
Southbound rail corridors connect western Canadian production hubs with major American railway interchanges and Midwestern markets.
Analytical Limits and Monthly Revisions
Statistics Canada systematically revises railway carloadings data with each subsequent monthly release to incorporate delayed operator returns.
Carloading statistics record the volume of freight initially loaded on Canadian tracks but do not track ultimate delivery destinations.
Freight loading totals cannot be directly equated with export trade figures or marine terminal vessel discharge volumes.
Data tables capture origin activity within western boundaries but exclude railway track maintenance capital expenditures and labor dispute metrics.
Statistical confidentiality rules suppress individual commodity carload figures when a single carrier or shipper dominates a specific movement.
Sound economic analysis treats Western Division carloadings as a measure of origin freight throughput rather than a comprehensive national trade balance.
B1 · Intermediate
Statistics Canada Western Division Rail Freight: A Reporting Geography
Monthly railway carloadings data capture origin freight tonnage across Western Canada while distinguishing statistical boundaries from individual corridors.
Western Division Statistical Geography
Statistics Canada defines the Western Division as freight rail loadings originating from Thunder Bay west to the Pacific Coast.
The Western Division represents a statistical reporting geography rather than an individual rail route, track corridor, or terminal complex.
Data boundaries encompass railway trackage across northwestern Ontario, Manitoba, Saskatchewan, Alberta, and British Columbia.
Official reporting aggregates origin freight carloadings from multiple competing railway operators across western track networks.
The geographic boundary maintains consistency with long-standing historical grain transportation and freight accounting divisions.
Survey guidelines prohibit treating the entire division as a unified single-operator corridor or dedicated pipeline.
Monthly Total Tonnage Measurements
Statistics Canada records monthly freight rail volume in both carload counts and thousands of metric tonnes.
Western Division monthly freight volumes typically total between 15 and 18 million metric tonnes of carried commodities.
Monthly railway carloadings data are collected on an unadjusted basis and are not seasonally adjusted.
Loading volumes exhibit distinct seasonal variance driven by agricultural harvest schedules, severe winter weather, and construction demand.
Statistical tables report rail freight originated within the Western Division separately from eastern loadings and traffic received from American rail connections.
Monthly carload counts provide an immediate operational metric of rolling stock utilization across western rail terminals.
Intermodal and Non-Intermodal Freight Dynamics
Official statistics categorize all western railway freight into non-intermodal carload traffic and intermodal container shipments.
Non-intermodal bulk commodities constitute the vast majority of total western tonnage, usually exceeding 85 percent of all loadings.
Intermodal freight measures cargo packed into standardized containers and trailers transported on dedicated flatcars or well cars.
Intermodal tonnage connects inland western distribution hubs with Pacific container terminals located in Vancouver and Prince Rupert.
Non-intermodal rail movements utilize specialized heavy rolling stock including covered grain hoppers, tank cars, gondolas, and centerbeam flatcars.
Containerized intermodal freight maintains faster velocity schedules compared to heavy bulk unit train movements.
Primary Commodity Volume Tracking
Official tables track non-intermodal railway carloadings across 64 discrete commodity categories derived from standard classification systems.
Agricultural products represent a core commodity category, with wheat, canola, and specialty crops generating hundreds of thousands of monthly tonnes.
Mined commodities including coal and potash account for substantial non-intermodal carloadings originating in Alberta, British Columbia, and Saskatchewan.
Forestry products including lumber, wood pulp, and paper generate recurring monthly freight traffic from interior mills across British Columbia and Alberta.
Energy commodities such as crude oil, fuel products, and liquefied gases are quantified under chemical and petroleum product headings.
Monthly commodity data records the net weight of cargo loaded, excluding the tare weight of rail freight cars.
Strategic Corridors and Western Cargo Flows
Western rail traffic flows along dual transcontinental mainlines cutting through the Rocky Mountains and Fraser Canyon river passes toward coastal marine gateways.
Thunder Bay serves as the eastern boundary and primary lake port linking prairie grain gathering with Great Lakes marine shipping.
Pacific port terminals receive the majority of export-directed western bulk unit trains and intermodal flatcars.
Inland primary grain elevators coordinate unit train assembly of up to 134 hopper cars to maximize rail network velocity.
Severe winter conditions in western mountain corridors necessitate reduced train lengths and lower operating speeds to maintain safety.
Southbound rail corridors connect western Canadian production hubs with major American railway interchanges and Midwestern markets.
Analytical Limits and Monthly Revisions
Statistics Canada systematically revises railway carloadings data with each subsequent monthly release to incorporate delayed operator returns.
Carloading statistics record the volume of freight initially loaded on Canadian tracks but do not track ultimate delivery destinations.
Freight loading totals cannot be directly equated with export trade figures or marine terminal vessel discharge volumes.
Data tables capture origin activity within western boundaries but exclude railway track maintenance capital expenditures and labor dispute metrics.
Statistical confidentiality rules suppress individual commodity carload figures when a single carrier or shipper dominates a specific movement.
Sound economic analysis treats Western Division carloadings as a measure of origin freight throughput rather than a comprehensive national trade balance.
B2 · Upper Intermediate
Statistics Canada Western Division Rail Freight: A Reporting Geography
Monthly railway carloadings data capture origin freight tonnage across Western Canada while distinguishing statistical boundaries from individual corridors.
Western Division Statistical Geography
Statistics Canada defines the Western Division as freight rail loadings originating from Thunder Bay west to the Pacific Coast.
The Western Division represents a statistical reporting geography rather than an individual rail route, track corridor, or terminal complex.
Data boundaries encompass railway trackage across northwestern Ontario, Manitoba, Saskatchewan, Alberta, and British Columbia.
Official reporting aggregates origin freight carloadings from multiple competing railway operators across western track networks.
The geographic boundary maintains consistency with long-standing historical grain transportation and freight accounting divisions.
Survey guidelines prohibit treating the entire division as a unified single-operator corridor or dedicated pipeline.
Monthly Total Tonnage Measurements
Statistics Canada records monthly freight rail volume in both carload counts and thousands of metric tonnes.
Western Division monthly freight volumes typically total between 15 and 18 million metric tonnes of carried commodities.
Monthly railway carloadings data are collected on an unadjusted basis and are not seasonally adjusted.
Loading volumes exhibit distinct seasonal variance driven by agricultural harvest schedules, severe winter weather, and construction demand.
Statistical tables report rail freight originated within the Western Division separately from eastern loadings and traffic received from American rail connections.
Monthly carload counts provide an immediate operational metric of rolling stock utilization across western rail terminals.
Intermodal and Non-Intermodal Freight Dynamics
Official statistics categorize all western railway freight into non-intermodal carload traffic and intermodal container shipments.
Non-intermodal bulk commodities constitute the vast majority of total western tonnage, usually exceeding 85 percent of all loadings.
Intermodal freight measures cargo packed into standardized containers and trailers transported on dedicated flatcars or well cars.
Intermodal tonnage connects inland western distribution hubs with Pacific container terminals located in Vancouver and Prince Rupert.
Non-intermodal rail movements utilize specialized heavy rolling stock including covered grain hoppers, tank cars, gondolas, and centerbeam flatcars.
Containerized intermodal freight maintains faster velocity schedules compared to heavy bulk unit train movements.
Primary Commodity Volume Tracking
Official tables track non-intermodal railway carloadings across 64 discrete commodity categories derived from standard classification systems.
Agricultural products represent a core commodity category, with wheat, canola, and specialty crops generating hundreds of thousands of monthly tonnes.
Mined commodities including coal and potash account for substantial non-intermodal carloadings originating in Alberta, British Columbia, and Saskatchewan.
Forestry products including lumber, wood pulp, and paper generate recurring monthly freight traffic from interior mills across British Columbia and Alberta.
Energy commodities such as crude oil, fuel products, and liquefied gases are quantified under chemical and petroleum product headings.
Monthly commodity data records the net weight of cargo loaded, excluding the tare weight of rail freight cars.
Strategic Corridors and Western Cargo Flows
Western rail traffic flows along dual transcontinental mainlines cutting through the Rocky Mountains and Fraser Canyon river passes toward coastal marine gateways.
Thunder Bay serves as the eastern boundary and primary lake port linking prairie grain gathering with Great Lakes marine shipping.
Pacific port terminals receive the majority of export-directed western bulk unit trains and intermodal flatcars.
Inland primary grain elevators coordinate unit train assembly of up to 134 hopper cars to maximize rail network velocity.
Severe winter conditions in western mountain corridors necessitate reduced train lengths and lower operating speeds to maintain safety.
Southbound rail corridors connect western Canadian production hubs with major American railway interchanges and Midwestern markets.
Analytical Limits and Monthly Revisions
Statistics Canada systematically revises railway carloadings data with each subsequent monthly release to incorporate delayed operator returns.
Carloading statistics record the volume of freight initially loaded on Canadian tracks but do not track ultimate delivery destinations.
Freight loading totals cannot be directly equated with export trade figures or marine terminal vessel discharge volumes.
Data tables capture origin activity within western boundaries but exclude railway track maintenance capital expenditures and labor dispute metrics.
Statistical confidentiality rules suppress individual commodity carload figures when a single carrier or shipper dominates a specific movement.
Sound economic analysis treats Western Division carloadings as a measure of origin freight throughput rather than a comprehensive national trade balance.
C1 · Advanced
Statistics Canada Western Division Rail Freight: A Reporting Geography
Monthly railway carloadings data capture origin freight tonnage across Western Canada while distinguishing statistical boundaries from individual corridors.
Western Division Statistical Geography
Statistics Canada defines the Western Division as freight rail loadings originating from Thunder Bay west to the Pacific Coast.
The Western Division represents a statistical reporting geography rather than an individual rail route, track corridor, or terminal complex.
Data boundaries encompass railway trackage across northwestern Ontario, Manitoba, Saskatchewan, Alberta, and British Columbia.
Official reporting aggregates origin freight carloadings from multiple competing railway operators across western track networks.
The geographic boundary maintains consistency with long-standing historical grain transportation and freight accounting divisions.
Survey guidelines prohibit treating the entire division as a unified single-operator corridor or dedicated pipeline.
Monthly Total Tonnage Measurements
Statistics Canada records monthly freight rail volume in both carload counts and thousands of metric tonnes.
Western Division monthly freight volumes typically total between 15 and 18 million metric tonnes of carried commodities.
Monthly railway carloadings data are collected on an unadjusted basis and are not seasonally adjusted.
Loading volumes exhibit distinct seasonal variance driven by agricultural harvest schedules, severe winter weather, and construction demand.
Statistical tables report rail freight originated within the Western Division separately from eastern loadings and traffic received from American rail connections.
Monthly carload counts provide an immediate operational metric of rolling stock utilization across western rail terminals.
Intermodal and Non-Intermodal Freight Dynamics
Official statistics categorize all western railway freight into non-intermodal carload traffic and intermodal container shipments.
Non-intermodal bulk commodities constitute the vast majority of total western tonnage, usually exceeding 85 percent of all loadings.
Intermodal freight measures cargo packed into standardized containers and trailers transported on dedicated flatcars or well cars.
Intermodal tonnage connects inland western distribution hubs with Pacific container terminals located in Vancouver and Prince Rupert.
Non-intermodal rail movements utilize specialized heavy rolling stock including covered grain hoppers, tank cars, gondolas, and centerbeam flatcars.
Containerized intermodal freight maintains faster velocity schedules compared to heavy bulk unit train movements.
Primary Commodity Volume Tracking
Official tables track non-intermodal railway carloadings across 64 discrete commodity categories derived from standard classification systems.
Agricultural products represent a core commodity category, with wheat, canola, and specialty crops generating hundreds of thousands of monthly tonnes.
Mined commodities including coal and potash account for substantial non-intermodal carloadings originating in Alberta, British Columbia, and Saskatchewan.
Forestry products including lumber, wood pulp, and paper generate recurring monthly freight traffic from interior mills across British Columbia and Alberta.
Energy commodities such as crude oil, fuel products, and liquefied gases are quantified under chemical and petroleum product headings.
Monthly commodity data records the net weight of cargo loaded, excluding the tare weight of rail freight cars.
Strategic Corridors and Western Cargo Flows
Western rail traffic flows along dual transcontinental mainlines cutting through the Rocky Mountains and Fraser Canyon river passes toward coastal marine gateways.
Thunder Bay serves as the eastern boundary and primary lake port linking prairie grain gathering with Great Lakes marine shipping.
Pacific port terminals receive the majority of export-directed western bulk unit trains and intermodal flatcars.
Inland primary grain elevators coordinate unit train assembly of up to 134 hopper cars to maximize rail network velocity.
Severe winter conditions in western mountain corridors necessitate reduced train lengths and lower operating speeds to maintain safety.
Southbound rail corridors connect western Canadian production hubs with major American railway interchanges and Midwestern markets.
Analytical Limits and Monthly Revisions
Statistics Canada systematically revises railway carloadings data with each subsequent monthly release to incorporate delayed operator returns.
Carloading statistics record the volume of freight initially loaded on Canadian tracks but do not track ultimate delivery destinations.
Freight loading totals cannot be directly equated with export trade figures or marine terminal vessel discharge volumes.
Data tables capture origin activity within western boundaries but exclude railway track maintenance capital expenditures and labor dispute metrics.
Statistical confidentiality rules suppress individual commodity carload figures when a single carrier or shipper dominates a specific movement.
Sound economic analysis treats Western Division carloadings as a measure of origin freight throughput rather than a comprehensive national trade balance.
C2 · Mastery
Statistics Canada Western Division Rail Freight: A Reporting Geography
Monthly railway carloadings data capture origin freight tonnage across Western Canada while distinguishing statistical boundaries from individual corridors.
Western Division Statistical Geography
Statistics Canada defines the Western Division as freight rail loadings originating from Thunder Bay west to the Pacific Coast.
The Western Division represents a statistical reporting geography rather than an individual rail route, track corridor, or terminal complex.
Data boundaries encompass railway trackage across northwestern Ontario, Manitoba, Saskatchewan, Alberta, and British Columbia.
Official reporting aggregates origin freight carloadings from multiple competing railway operators across western track networks.
The geographic boundary maintains consistency with long-standing historical grain transportation and freight accounting divisions.
Survey guidelines prohibit treating the entire division as a unified single-operator corridor or dedicated pipeline.
Monthly Total Tonnage Measurements
Statistics Canada records monthly freight rail volume in both carload counts and thousands of metric tonnes.
Western Division monthly freight volumes typically total between 15 and 18 million metric tonnes of carried commodities.
Monthly railway carloadings data are collected on an unadjusted basis and are not seasonally adjusted.
Loading volumes exhibit distinct seasonal variance driven by agricultural harvest schedules, severe winter weather, and construction demand.
Statistical tables report rail freight originated within the Western Division separately from eastern loadings and traffic received from American rail connections.
Monthly carload counts provide an immediate operational metric of rolling stock utilization across western rail terminals.
Intermodal and Non-Intermodal Freight Dynamics
Official statistics categorize all western railway freight into non-intermodal carload traffic and intermodal container shipments.
Non-intermodal bulk commodities constitute the vast majority of total western tonnage, usually exceeding 85 percent of all loadings.
Intermodal freight measures cargo packed into standardized containers and trailers transported on dedicated flatcars or well cars.
Intermodal tonnage connects inland western distribution hubs with Pacific container terminals located in Vancouver and Prince Rupert.
Non-intermodal rail movements utilize specialized heavy rolling stock including covered grain hoppers, tank cars, gondolas, and centerbeam flatcars.
Containerized intermodal freight maintains faster velocity schedules compared to heavy bulk unit train movements.
Primary Commodity Volume Tracking
Official tables track non-intermodal railway carloadings across 64 discrete commodity categories derived from standard classification systems.
Agricultural products represent a core commodity category, with wheat, canola, and specialty crops generating hundreds of thousands of monthly tonnes.
Mined commodities including coal and potash account for substantial non-intermodal carloadings originating in Alberta, British Columbia, and Saskatchewan.
Forestry products including lumber, wood pulp, and paper generate recurring monthly freight traffic from interior mills across British Columbia and Alberta.
Energy commodities such as crude oil, fuel products, and liquefied gases are quantified under chemical and petroleum product headings.
Monthly commodity data records the net weight of cargo loaded, excluding the tare weight of rail freight cars.
Strategic Corridors and Western Cargo Flows
Western rail traffic flows along dual transcontinental mainlines cutting through the Rocky Mountains and Fraser Canyon river passes toward coastal marine gateways.
Thunder Bay serves as the eastern boundary and primary lake port linking prairie grain gathering with Great Lakes marine shipping.
Pacific port terminals receive the majority of export-directed western bulk unit trains and intermodal flatcars.
Inland primary grain elevators coordinate unit train assembly of up to 134 hopper cars to maximize rail network velocity.
Severe winter conditions in western mountain corridors necessitate reduced train lengths and lower operating speeds to maintain safety.
Southbound rail corridors connect western Canadian production hubs with major American railway interchanges and Midwestern markets.
Analytical Limits and Monthly Revisions
Statistics Canada systematically revises railway carloadings data with each subsequent monthly release to incorporate delayed operator returns.
Carloading statistics record the volume of freight initially loaded on Canadian tracks but do not track ultimate delivery destinations.
Freight loading totals cannot be directly equated with export trade figures or marine terminal vessel discharge volumes.
Data tables capture origin activity within western boundaries but exclude railway track maintenance capital expenditures and labor dispute metrics.
Statistical confidentiality rules suppress individual commodity carload figures when a single carrier or shipper dominates a specific movement.
Sound economic analysis treats Western Division carloadings as a measure of origin freight throughput rather than a comprehensive national trade balance.
Check your understanding
Choose how closely you want to revisit the article. You can refer back while answering, and review explanations when you finish.
Quick Quiz A1
Try one question, then create a free account for the full Quick Quiz. Sign Up Free
Answer every question before checking. There is no time limit.
Your results
/ 1 correct (%)
Read the explanations to see how each answer connects to the article.
-
From which Ontario location does the Western Division statistical boundary begin westward?
1. Answer:
Quick Quiz A2
Try one question, then create a free account for the full Quick Quiz. Sign Up Free
Answer every question before checking. There is no time limit.
Your results
/ 1 correct (%)
Read the explanations to see how each answer connects to the article.
-
From which Ontario location does the Western Division statistical boundary begin westward?
1. Answer:
Quick Quiz B1
Try one question, then create a free account for the full Quick Quiz. Sign Up Free
Answer every question before checking. There is no time limit.
Your results
/ 1 correct (%)
Read the explanations to see how each answer connects to the article.
-
From which Ontario location does the Western Division statistical boundary begin westward?
1. Answer:
Quick Quiz B2
Try one question, then create a free account for the full Quick Quiz. Sign Up Free
Answer every question before checking. There is no time limit.
Your results
/ 1 correct (%)
Read the explanations to see how each answer connects to the article.
-
From which Ontario location does the Western Division statistical boundary begin westward?
1. Answer:
Quick Quiz C1
Try one question, then create a free account for the full Quick Quiz. Sign Up Free
Answer every question before checking. There is no time limit.
Your results
/ 1 correct (%)
Read the explanations to see how each answer connects to the article.
-
From which Ontario location does the Western Division statistical boundary begin westward?
1. Answer:
Quick Quiz C2
Try one question, then create a free account for the full Quick Quiz. Sign Up Free
Answer every question before checking. There is no time limit.
Your results
/ 1 correct (%)
Read the explanations to see how each answer connects to the article.
-
From which Ontario location does the Western Division statistical boundary begin westward?
1. Answer:
